Tour
Before installing anything, here is what SolidPing actually looks like.
Everything below is recorded from the real dashboard, not mocked up: the
video and screenshots are generated by driving the live UI with Playwright
(make showcase), so they get regenerated whenever the dashboard changes
instead of quietly going stale.
From docker run to the first result
One take, four beats: the published docker run one-liner booting the shipped
image; the first sign-in, including the forced password change every new
install starts with; creating an HTTP check — checks list → New check →
target URL and a name → how often it runs → which regions it runs from → save;
and the first response times arriving from two regions. The form opens on
the HTTP check type, so there is nothing to pick for the commonest case.
Two things in the cut are editing rather than product. Stretches where nothing is on screen — a page reloading, an org being provisioned over the API — are simply cut out. The wait on the detail page is not: a check has to run twice before its chart means anything, so that stretch is played faster with the speed burned into the corner, because a demo that quietly speeds up the slow part is a demo that lies about how fast the product is.
The camera pushes in on whatever is being filled in and pulls back out for every navigation — that framing is added in post-production from cue points the recording writes, so the dashboard you see is the shipped UI at its real size, never a zoomed browser.
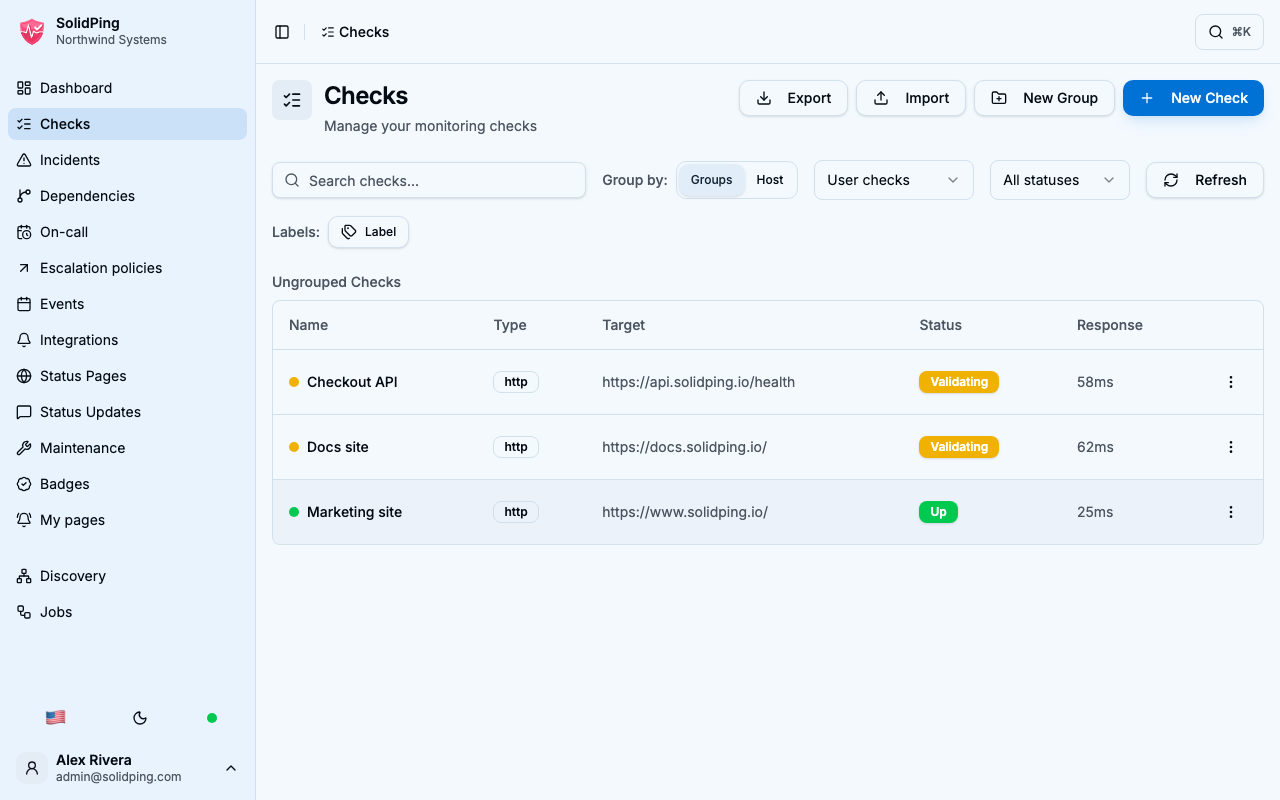
The checks list
Every check you monitor, with its current status at a glance. Checks can be grouped, filtered, and organised by host.
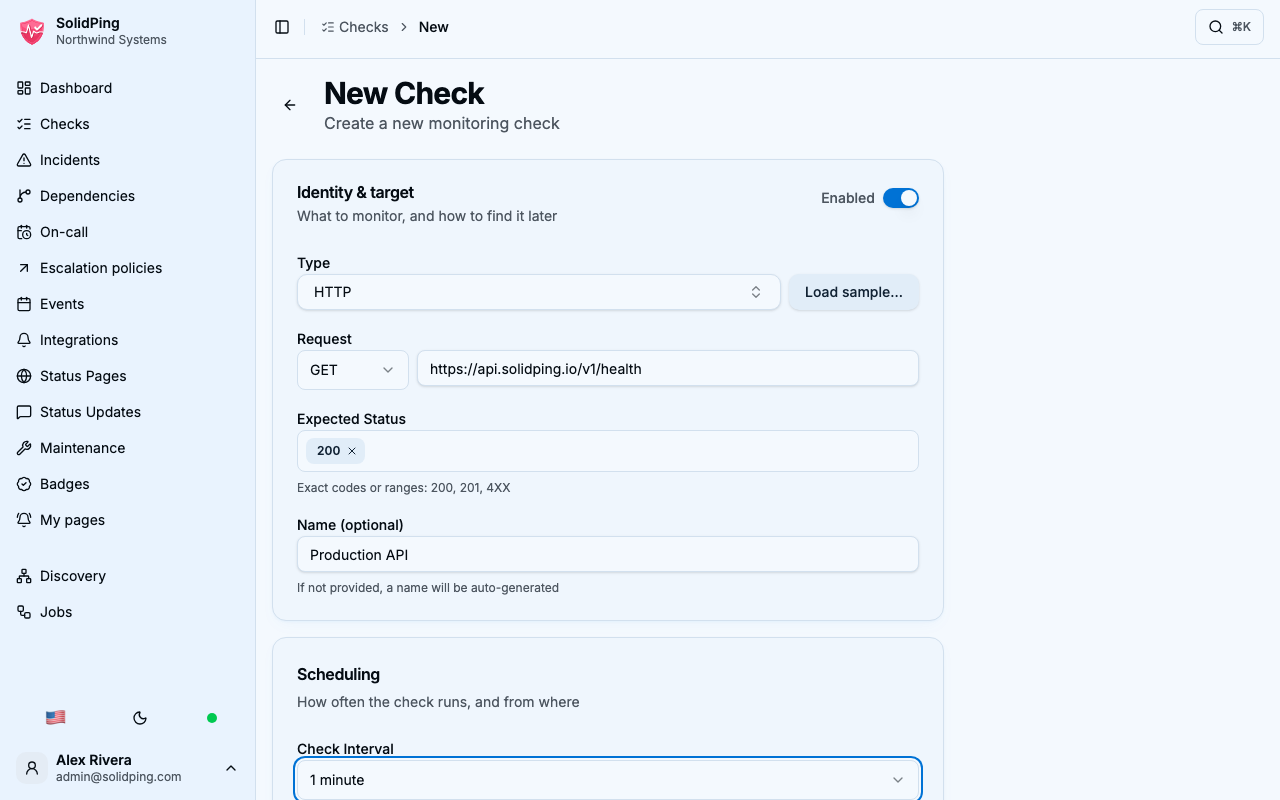
The new-check form
One form for every protocol. Pick the check type and the form reshapes itself around it — method, URL and expected status codes for HTTP, host and port for TCP, and so on. Scheduling — how often the check runs — sits just below. Once your install has more than one region, the region picker appears alongside it, as it does here: every selected region runs the check at the full interval, and the spread staggers them so they do not all fire at the same instant.
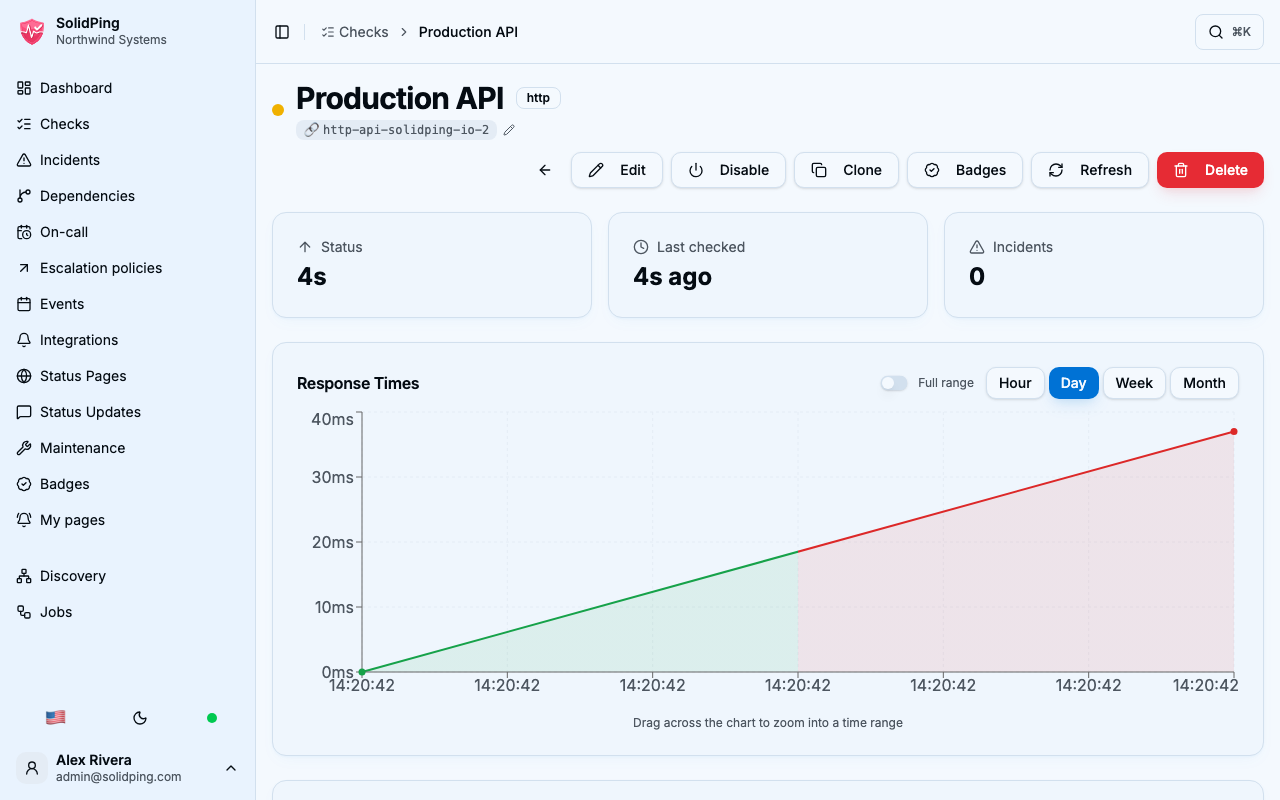
The check detail page
Once saved, the check starts running immediately. Its detail page shows the live status, response times over time — one series per region, with a selector to look at any of them on its own — and the raw result history.
Next steps
- Install SolidPing and create your first check
- Browse the check types SolidPing supports
- Read the configuration reference